
This blog post is part of the Trello Day Replay series of talks given by members of the Trello team, Google, and Typeform about different ways they’re using Trello to be more effective in life and work. For more inspiration, check out the rest of the talks here.
Every one of us creates and follows processes everyday. But it isn’t until that third hour at the DMV, waiting to renew a drivers license, that we really begin to think about how important it is for a process to be effective. So when I was putting together my talk for Trello Day, I decided to focus on how we monitor and analyze our processes’ performance, and make sure we continue to improve, optimize, and maintain the effectiveness.
Evaluating A Process
Often, we only discuss the processes around us when they are failing. But to truly evaluate the effectiveness of a process, you need to think of it objectively.
First, consider some common shortfalls: bottlenecks, time-intensive steps, energy-intensive steps, and drops in quality. Your team may consider a process to be completely broken, when it actually only has an energy-intensive bottleneck that keeps it from functioning. Fixing this problem could restore the system with less effort than a complete overhaul.
Second, consider opportunities for improvement: parallel tasks and best practices both come to mind. Even if your process isn’t broken, if it can be improved by executing some parts in parallel, then you can free up time for your team to focus on other challenges.
By taking these observations and folding them into the iteration of your design, you can work to continually assess, improve, and succeed.
Using Trello Connectors To Assess My Process
Many of us use Trello to bring structure, consistency, and scalability to the chaos of life and work. (The diversity of processes managed by Trello is amazing, ranging from tracking product roadmaps to planning a wedding!) But to assess the effectiveness of a process, it helps to gather objective data. Fortunately, Trello offers an API that allows users and services to access data for activities that take place on your board.
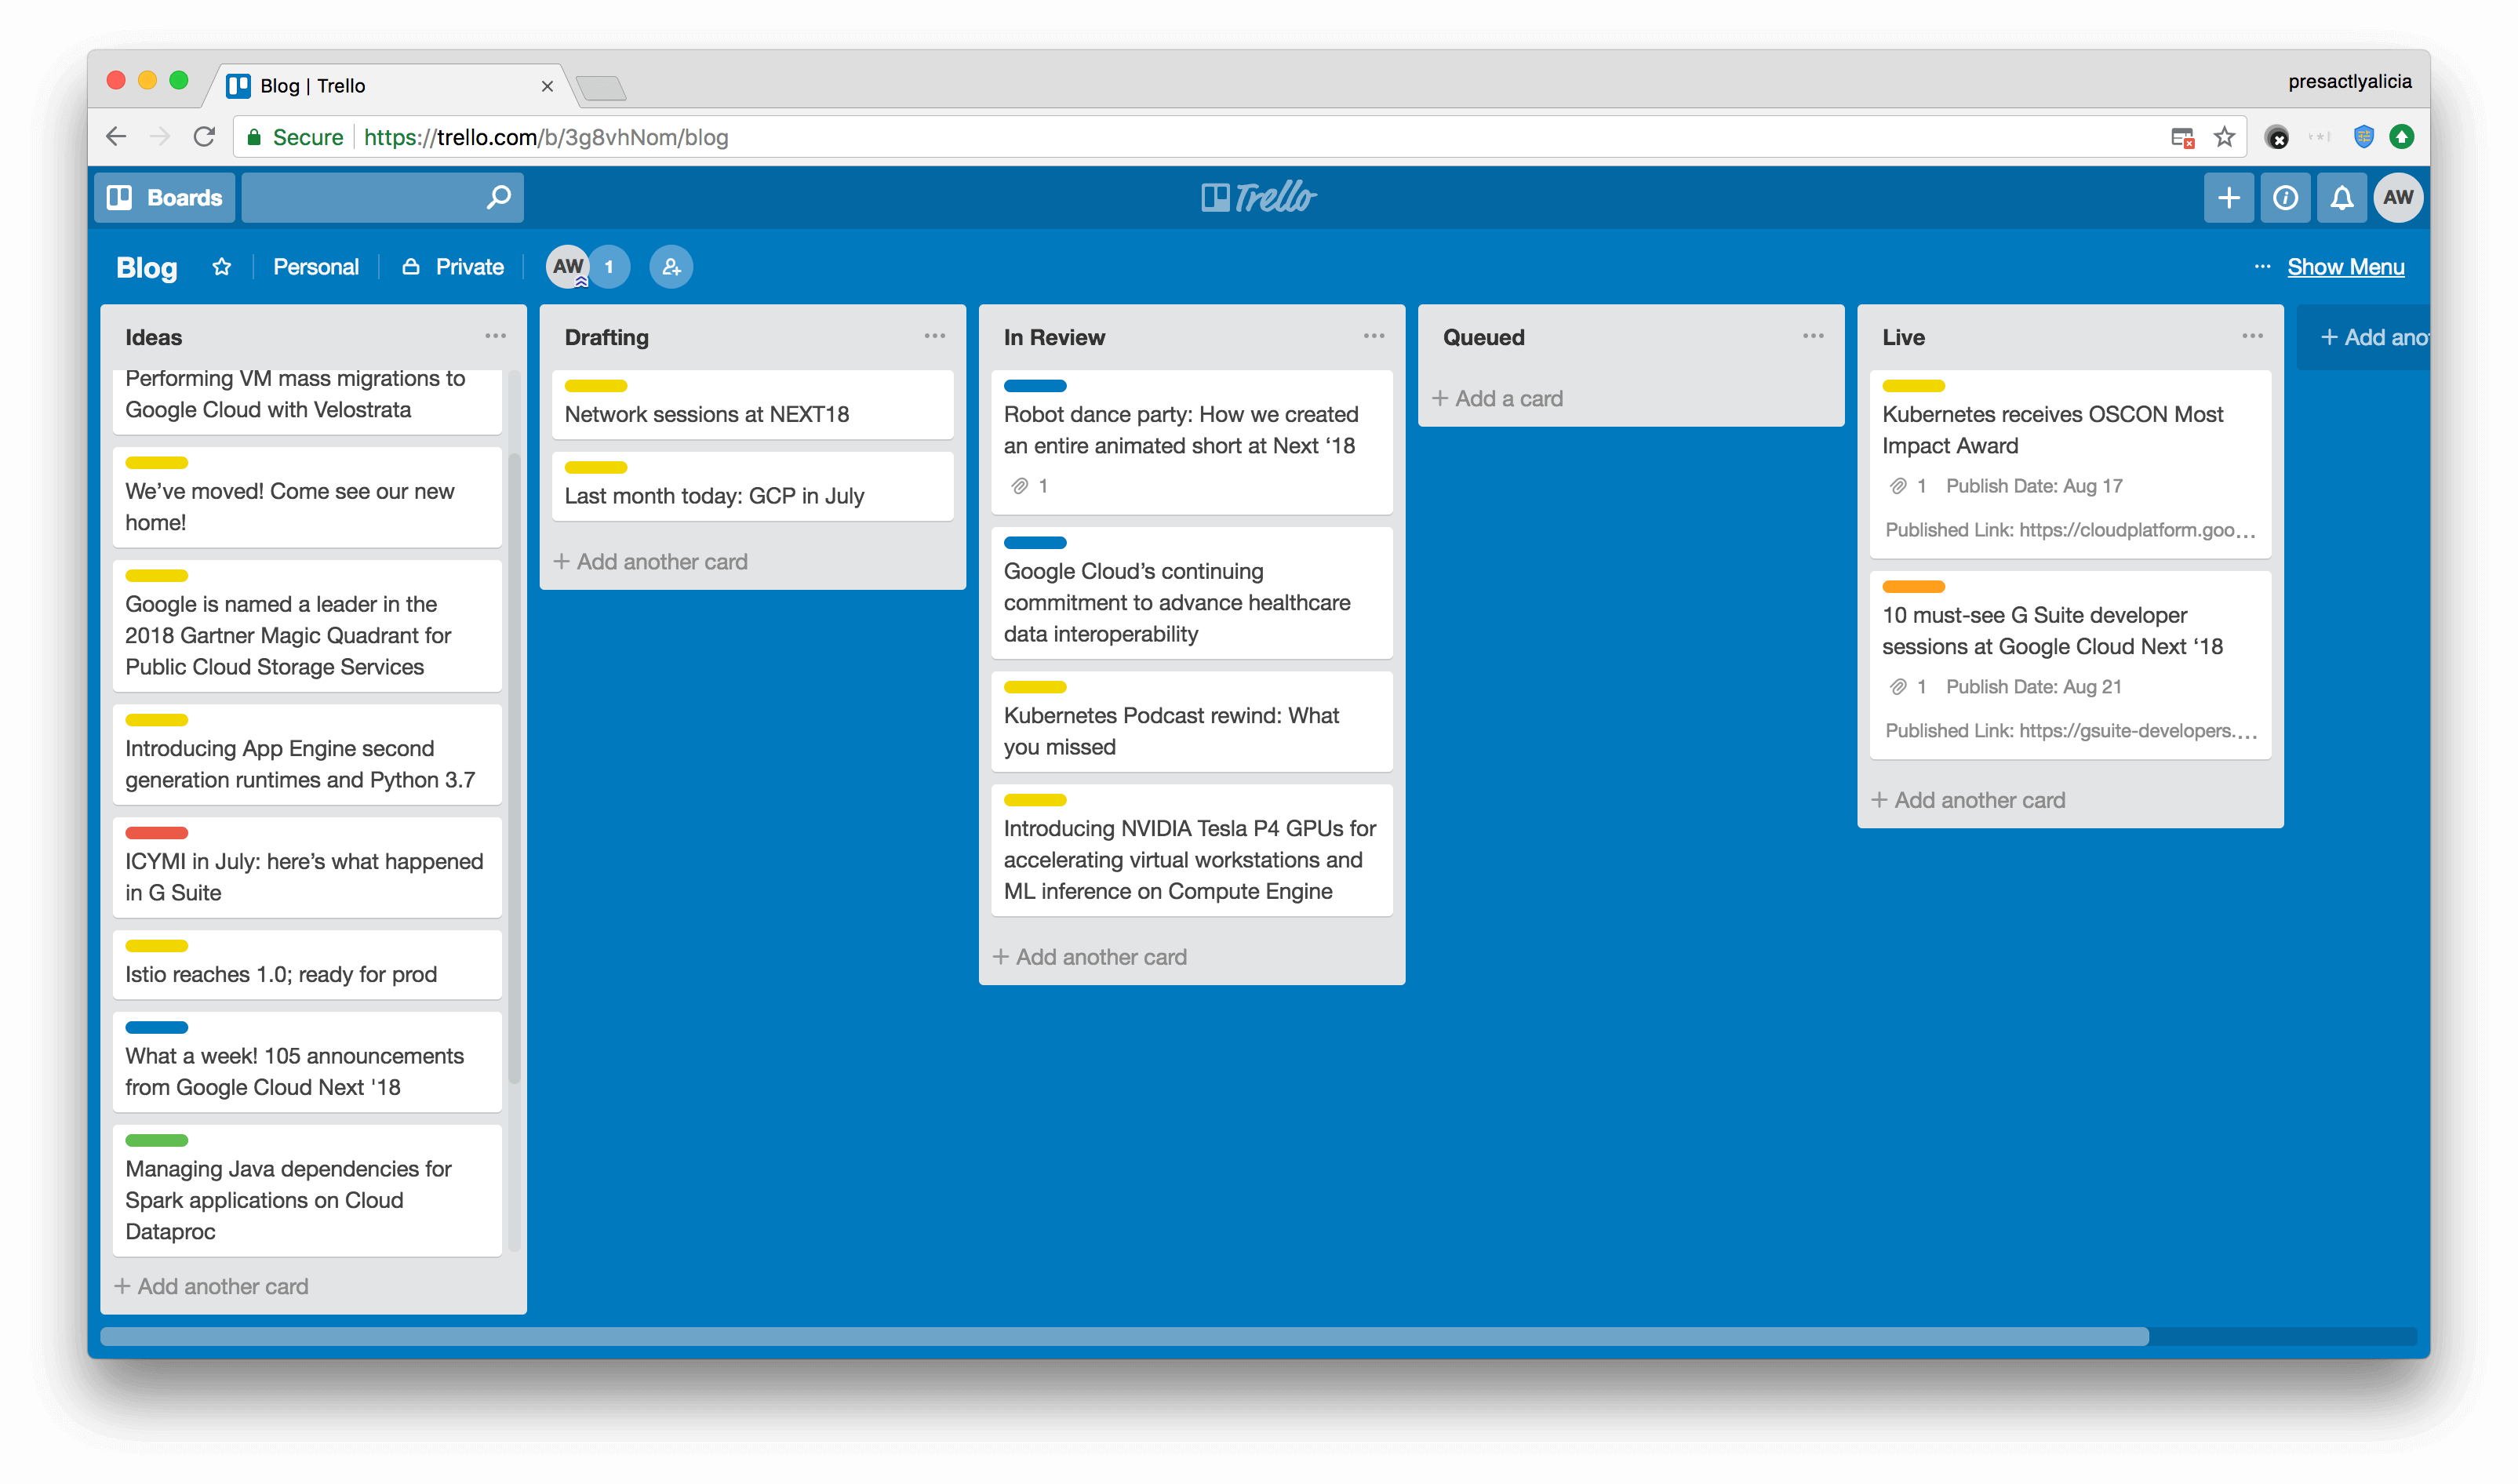
In my talk, I demonstrated how to access and analyze this activity data using a (fictional) Trello board built to manage a blog editorial, review, and publishing process. Confession: Instead of using the Trello API itself, I brought in a secret weapon called Zapier.
Zapier is an online automation tool that connects apps without requiring any code. Using its integrations for Trello and Google Sheets, I was able to set up an automation that logged each time a card on the board moved to a new list. With this data in Google Sheets, a few simple formulas revealed how much time each card (or blog post) spent on each list. Zapier also pulled in another piece of data tracked on the Trello card, the published blog posts’ URLs, which made it possible to match blog posts with their Google Analytics performance.
Rather than charting directly in Google Sheets, I connected to Data Studio with a few clicks and created a visualization to understand the trends (a polished dashboard never hurt anyone looking for process-improvement resources!).
If you’d like to see this full demo, feel free to watch my talk (video above). Otherwise, keep reading to see what we learned.
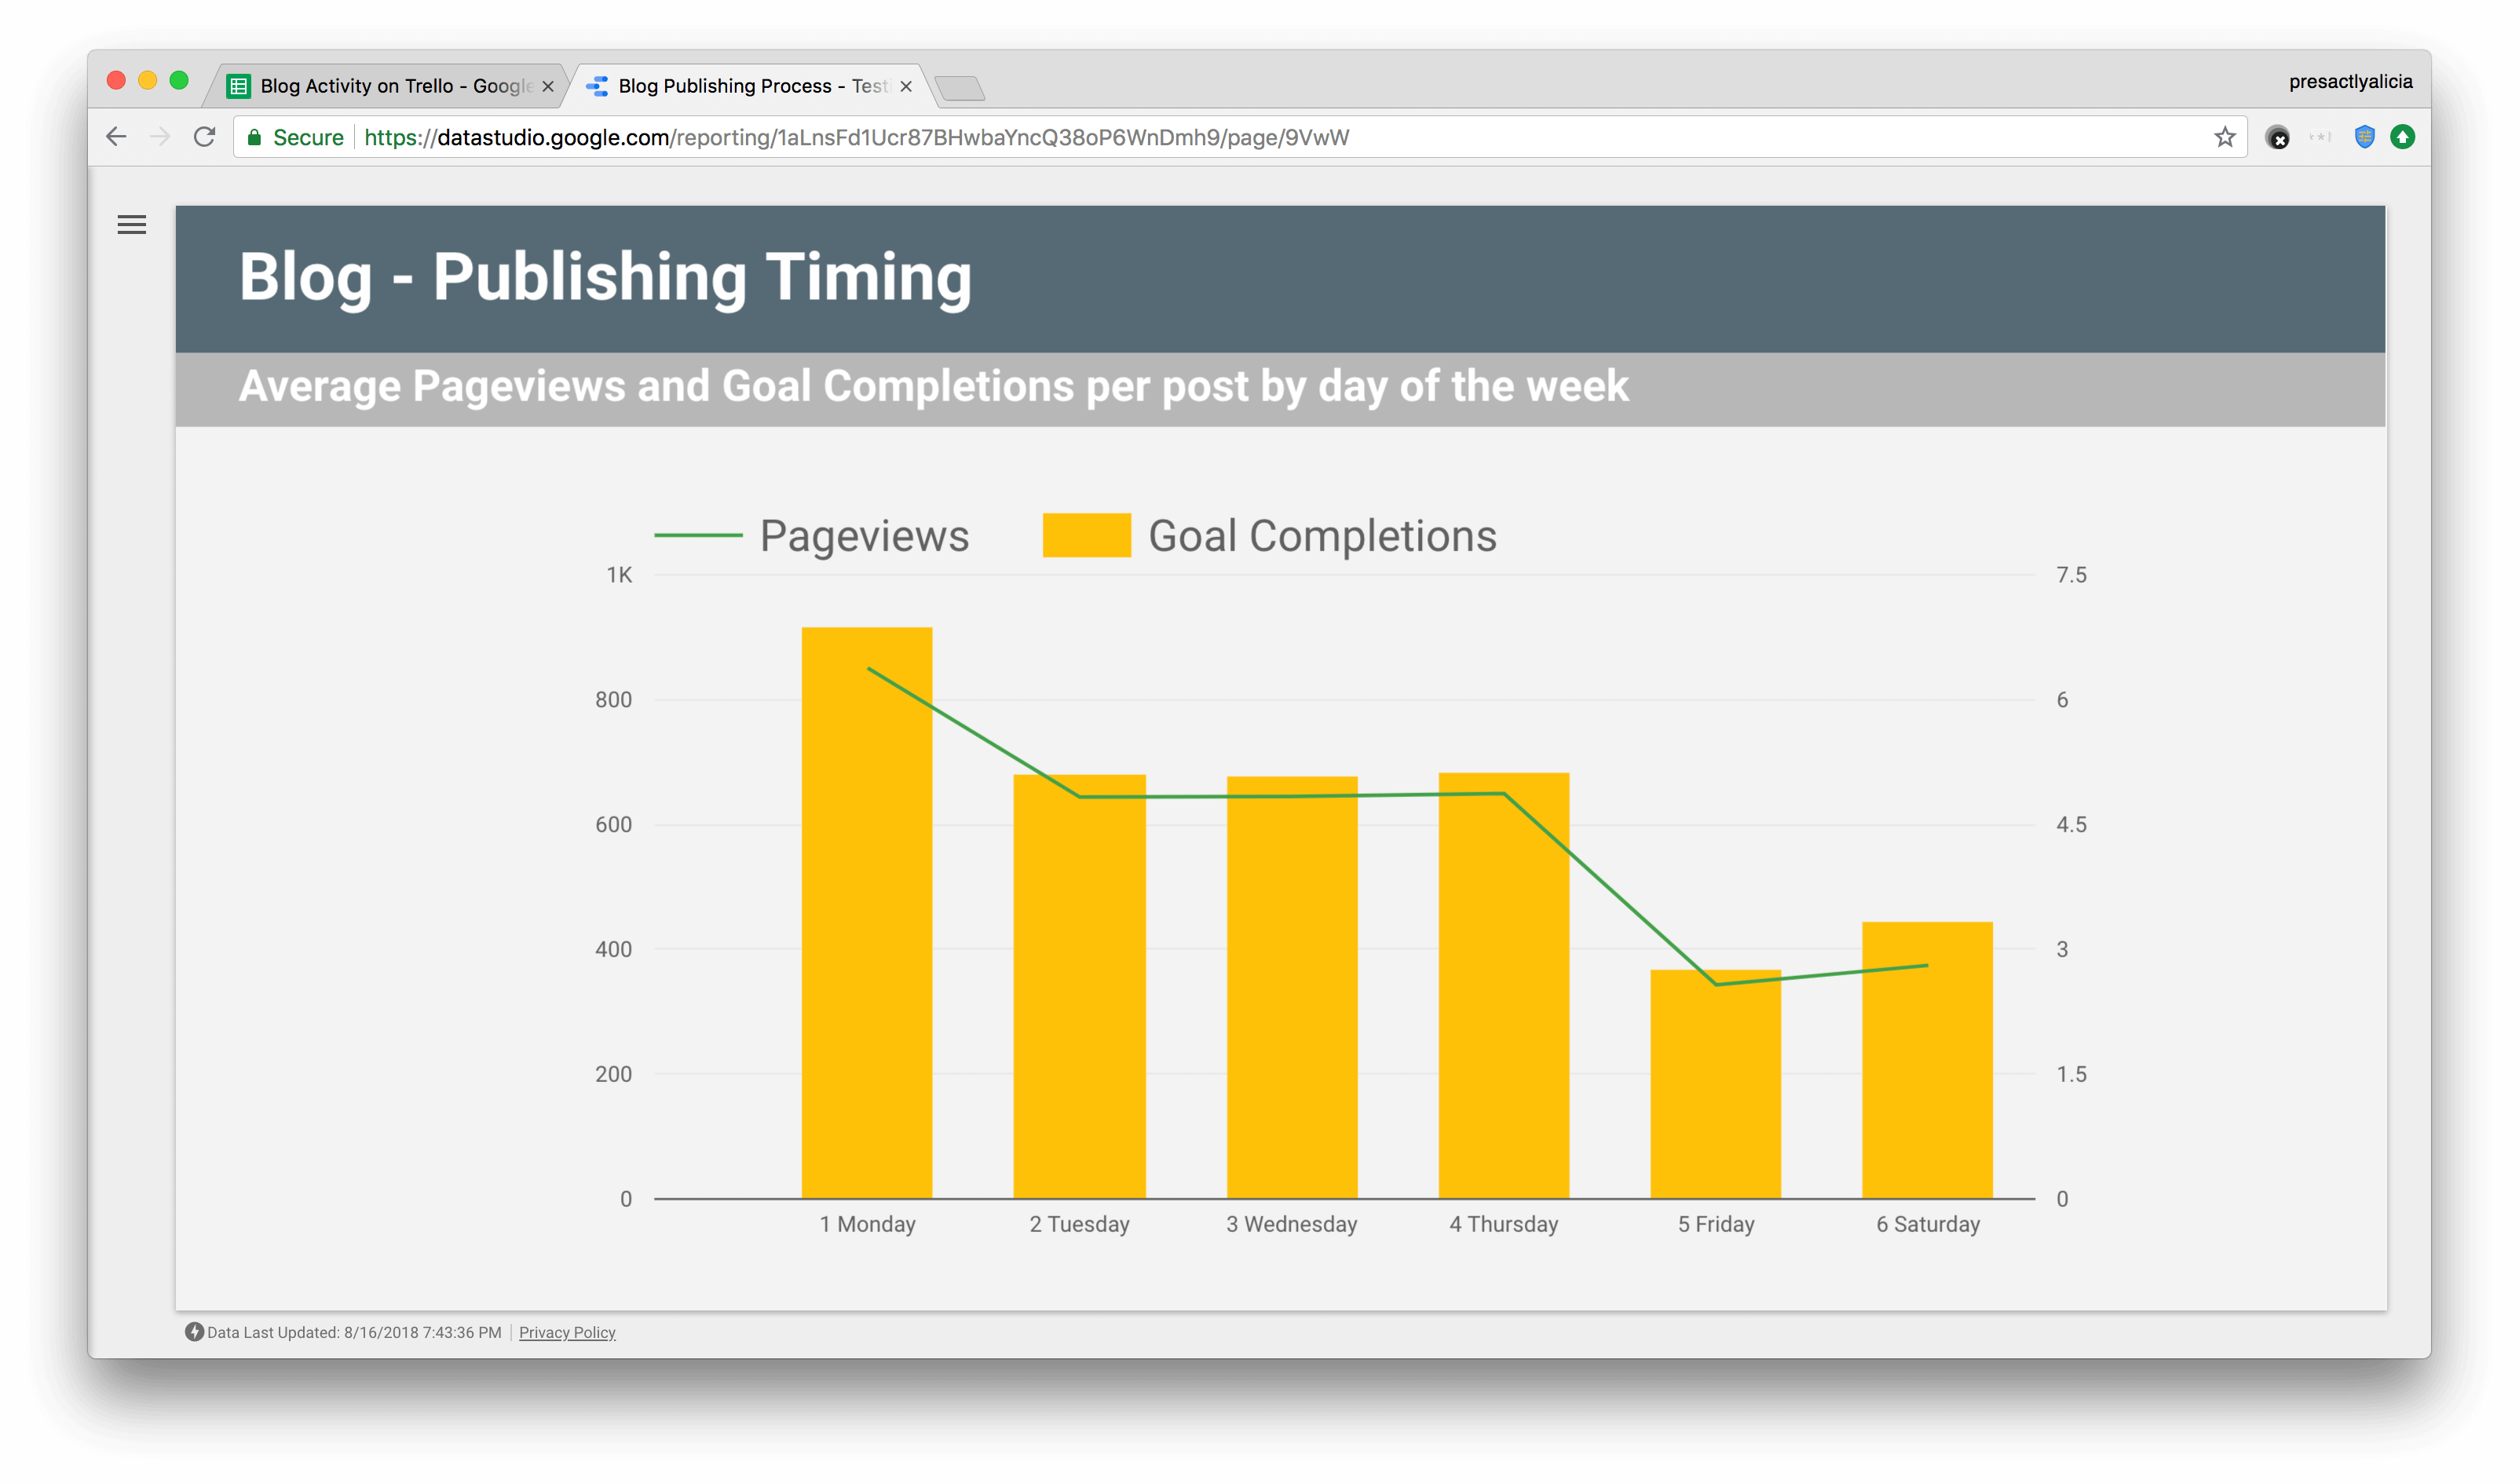
The analysis showed that blog posts perform best when published on a Monday. This information enables me to begin drafting a best practice, perhaps guiding the team to post important/high-priority content on Mondays, and to avoid Fridays altogether. Digging in a little more, I could investigate and identify other best practices, such as optimal number of posts in a day.
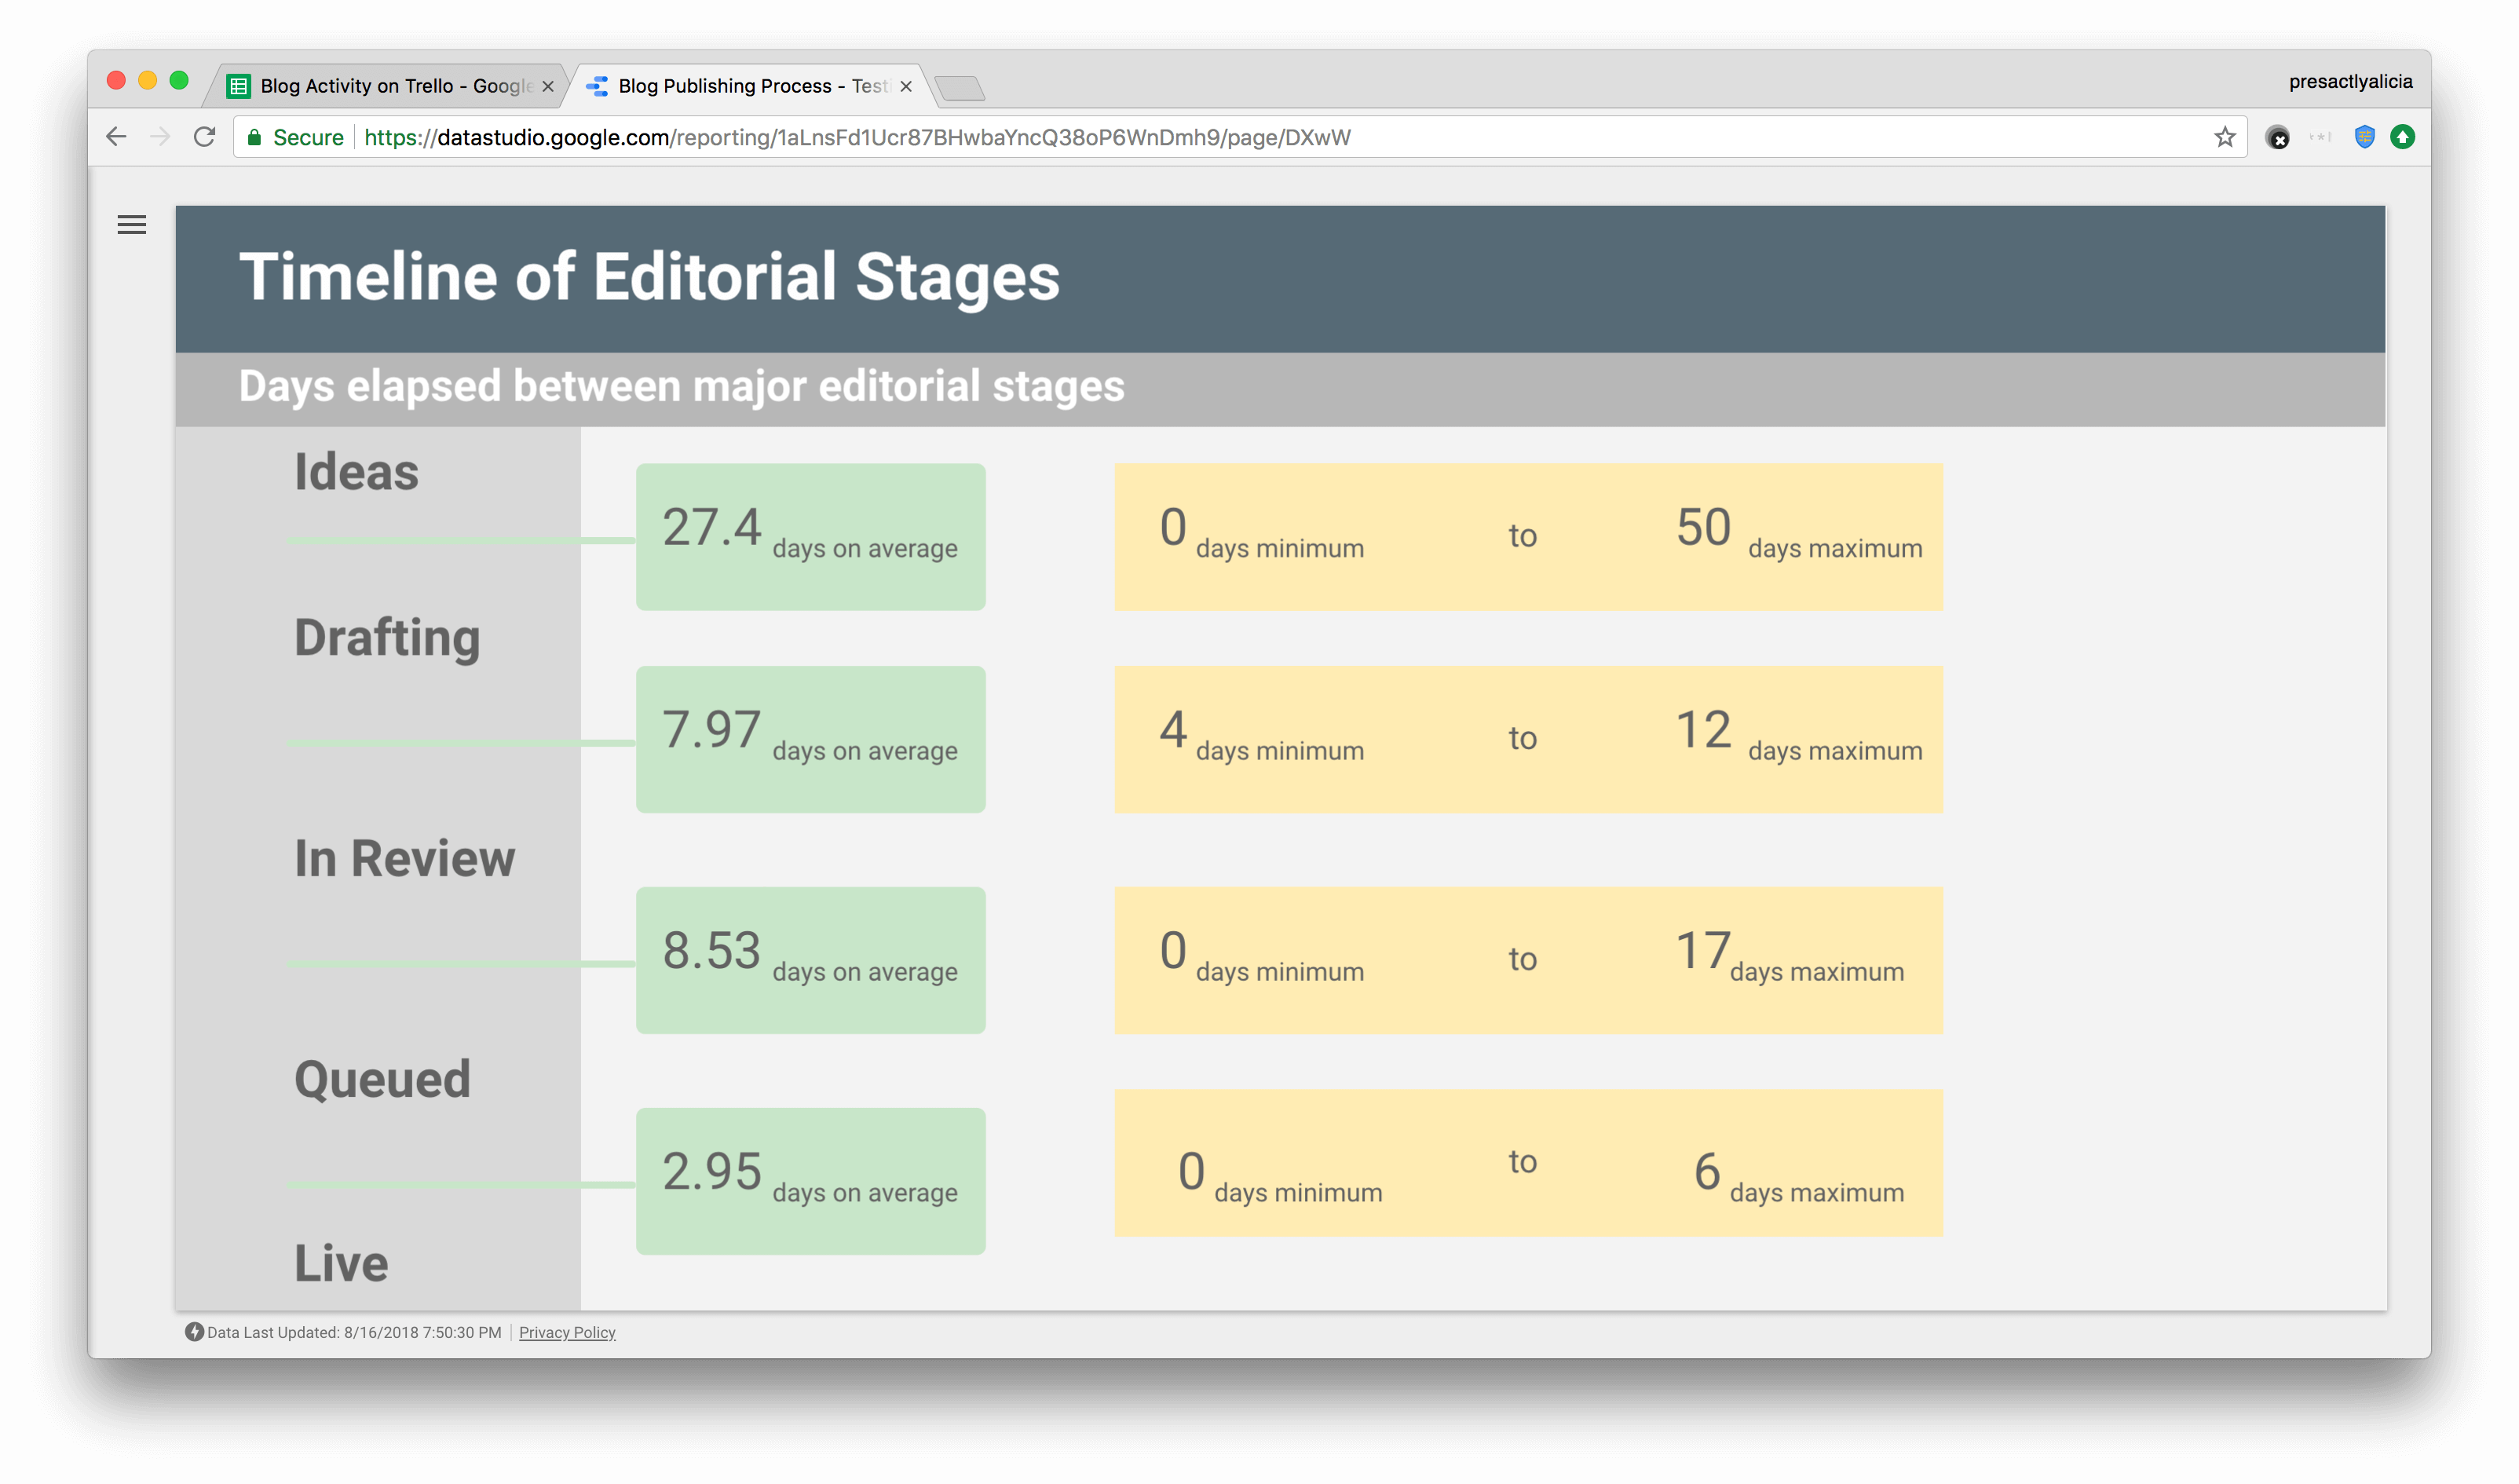
Further analysis showed that time to review a blog post varies widely. While I may not have the power to change how quickly the team develops and drafts ideas, I can work to ensure that the review time is consistent and concise, so that a drafted post can be published as quickly as possible. Improving this stage of my process may require hiring more reviewers, or creating standardized templates/checklists for review.
The solution isn’t the focus here. Rather, the data shows me a potential bottleneck or drop in quality in my existing (functional) process. Now I have a spot to experiment and improve.
What I really like about using Trello with Zapier and Google Sheets is how easy it is to customize for my use case. Trello is my process, and my team is able to work better for it.
Zapier is a great tool for connecting Trello and Sheets, bringing activity data from my process into a medium that I can visualize, with the advantage of being friendly to new users and not requiring developer skills.
And Sheets and Data Studio are collaborative tools for performing data analysis, allowing me to easily bring in experts and stakeholders when needed.
What’s Next?
No matter what processes Trello is managing for us, we need to make sure we continue to maintain their effectiveness.
So how can you get started analyzing your own Trello boards and workflows?
- I recommend setting up your own Zap using the free tier of Zapier.
- If you’re interested in using the Google Analytics add-on (if that happens to be part of your analysis), there’s more information in this solutions article.
- And finally, you can get started easily with Data Studio by following the getting started path in the support documentation.
I also invite you to follow me on Twitter and Medium, where I talk about data analysis with G Suite and Google Cloud Platform. And reach out! I’d love to hear your own discoveries!
Want even more inspiration from Trello users and team members? This blog post is part of the Trello Day Replay series. Check out more talks here.
Good or bad, we’d love to hear your thoughts. Find us on Twitter (@trello) or write in to support@trello.com