
There’s a way of delivering customer value at a higher rate and quality, all while staying responsive to the rapidly evolving market; one that doesn’t require exhaustive changes or a cultural overhaul.
It’s called the Kanban Method, and today it’s used by businesses ranging from small start-ups to world-renowned enterprises who aim to improve their service delivery, decision-making abilities, and team collaboration.

The Kanban Method In A Nutshell
The Kanban Method is the most flexible approach to managing work effectively, relieving team overburden and delivering customer value in a fast and predictable manner. In its simplest form, it follows the “To Do”, “Doing”, and “Done” workflow. It can also facilitate:
- Better visibility by enabling everyone to instantly see how work is moving through the flow.
- Improved efficiency by eliminating bottlenecks and too much work in progress.
- Increased productivity by shifting the focus from starting work to finishing work.
- Higher predictability by keeping your process stable and consistent.
- Effective collaboration by driving transparency and continuous improvement.
- Stronger company culture by promoting trust, respect and acts of leadership at all levels.
How can you reap these benefits?
Adopting core Kanban practices on Trello is a good start! Let’s walk through this flexible and powerful approach of managing work more effectively.
Bring Your Workflow To Light: Visualize The Process On A Trello board
First, you will need to visualize your workflow by mapping your value stream onto a Trello board.
The value stream is the series of steps required to deliver a product or a service to your customer. Think about the way you’re delivering work and create a new list for every step of that process.
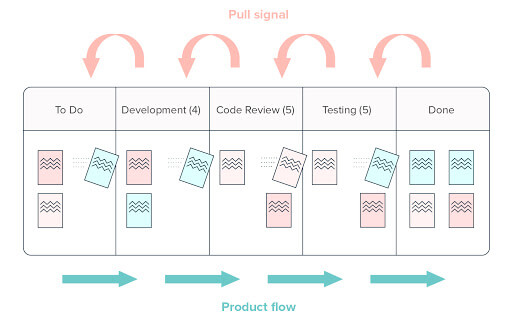
Let’s take a look at a development process with the following steps: To Do, Development, Code Review, Testing, and Done.
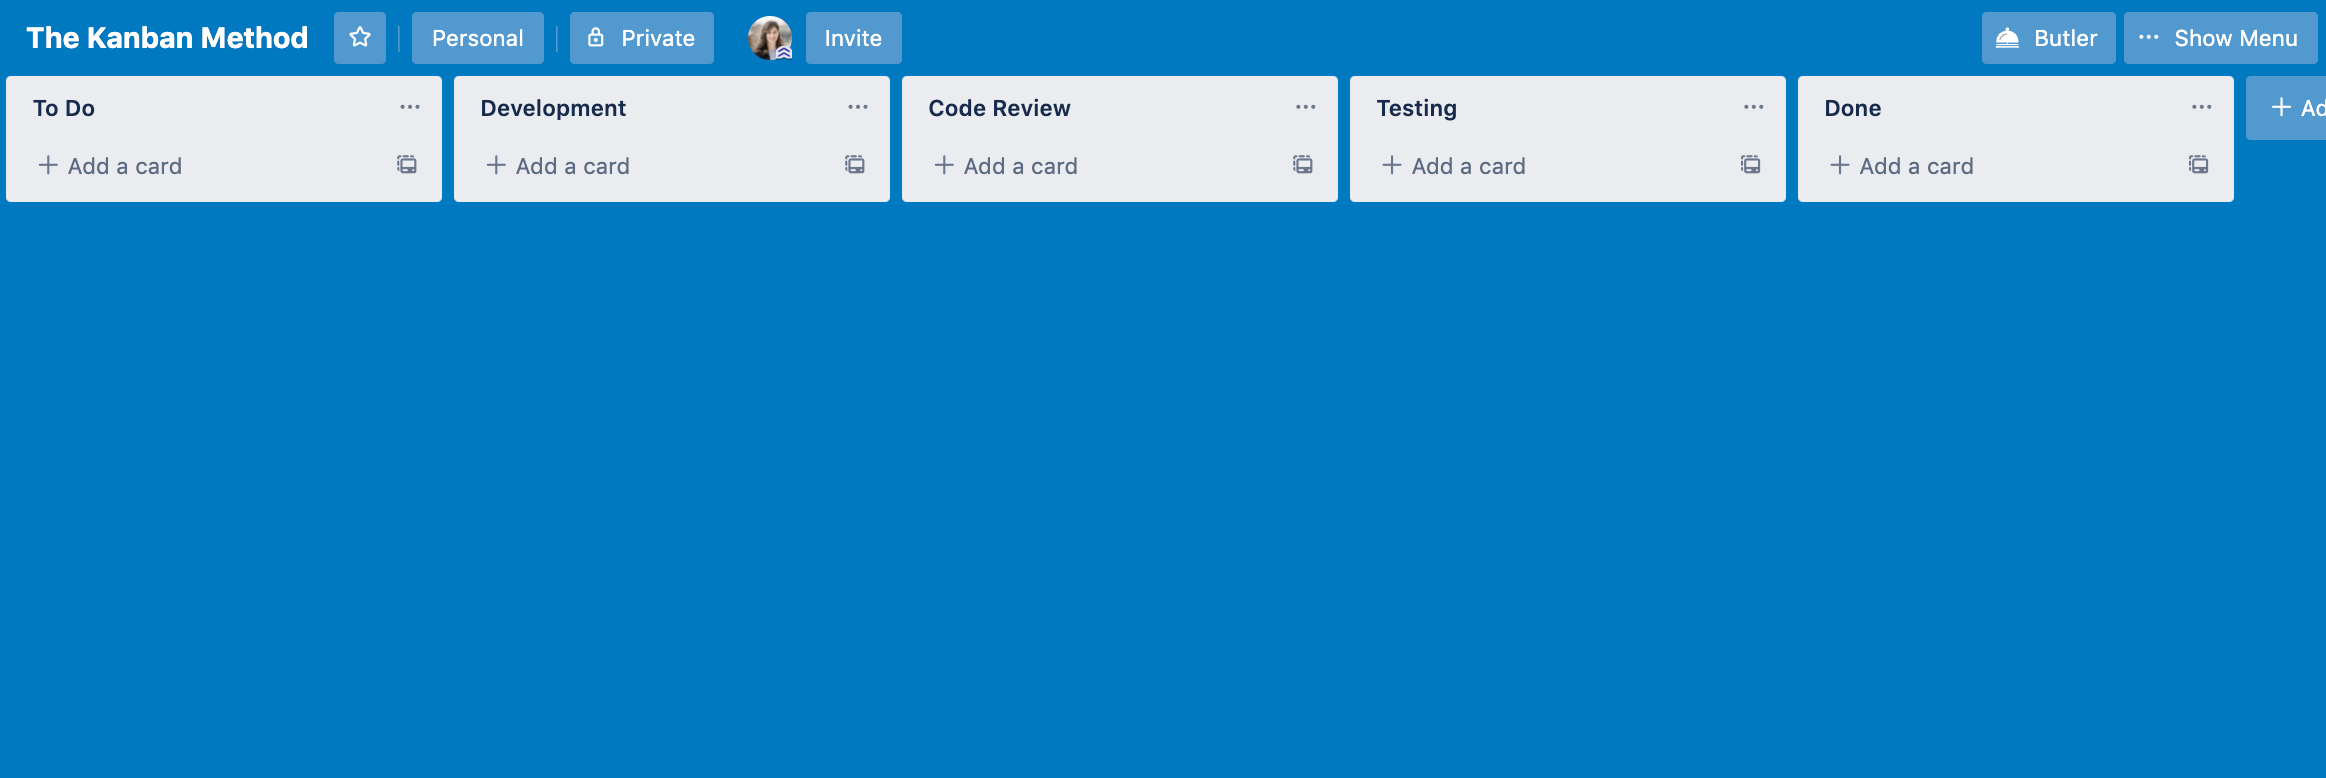
Each card in Trello corresponds to a task in your workflow. Cards move from left to right through the board until task completion. Each card can outline desired outcomes of customer value.
After reading a card, your team should know what the problem is they need to solve, for whom they’re solving it, and why they’re solving it.
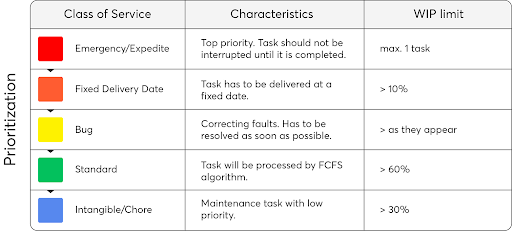
Place your cards in your To Do list. Use labels to assign each task with a Class of Service to define its priority. Classes of Service (CoS) are a set of policies that define how tasks interact with each other.
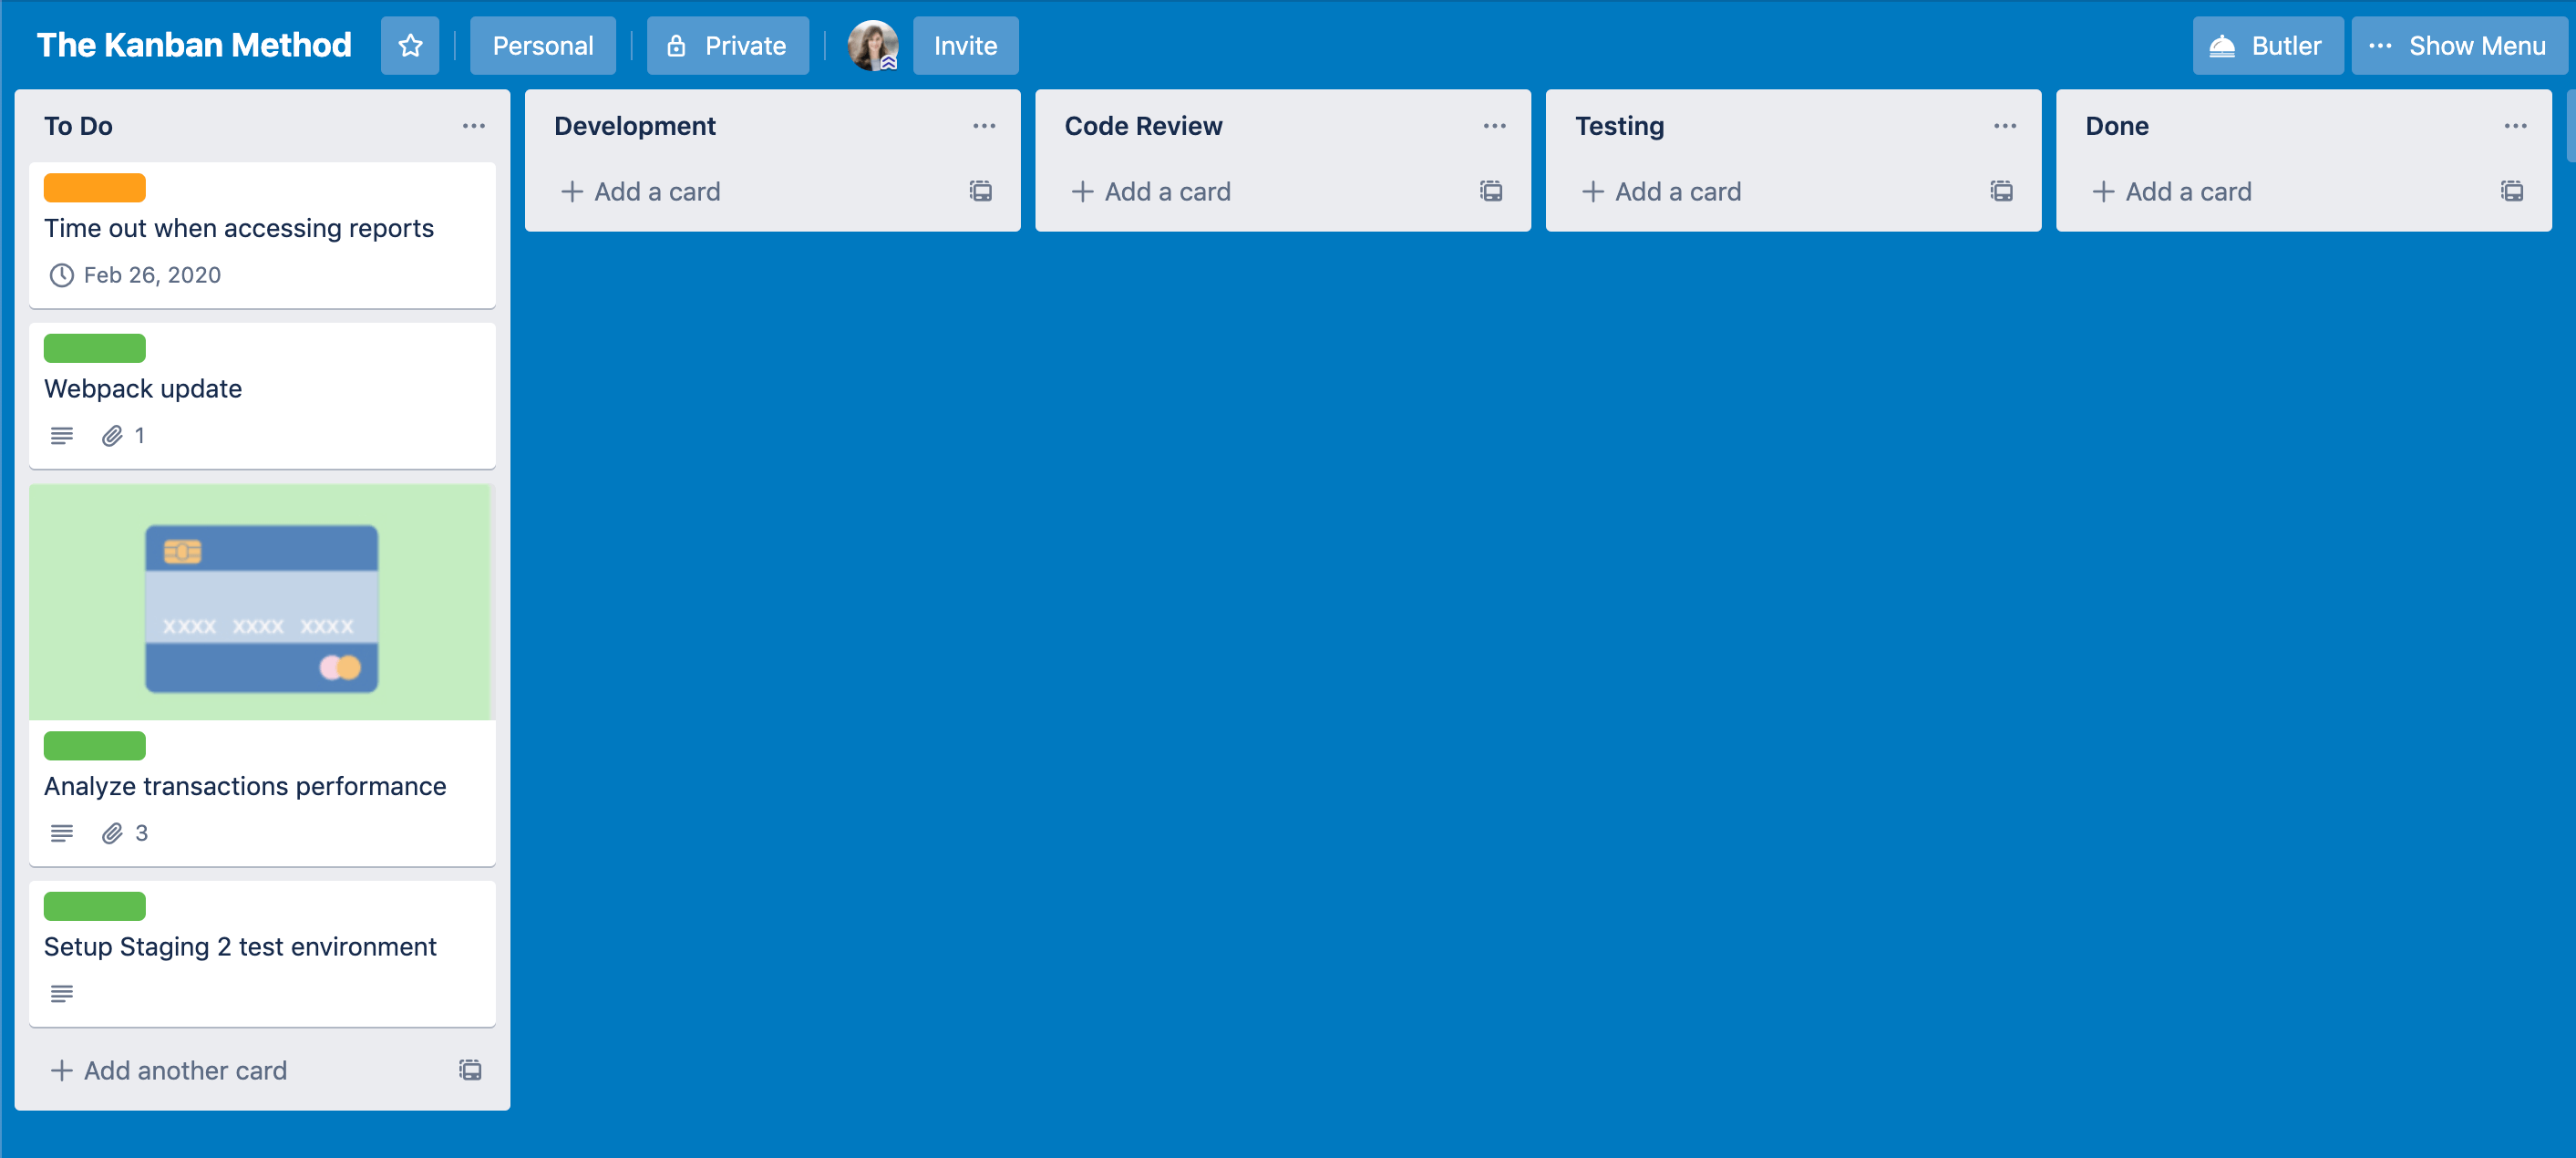
Think of them as guidelines providing structure and governance for your team. Server outages, network defects and critical production issues, for example, can be prioritized above your standard and non-urgent assignments.
By reading the card and its CoS, the team will be on the same page as to what they need to achieve and how they need to treat a task based on its classification.
Use the “About This Board” section on your Trello board to specify the explicit policies in your process so everyone knows what rules to follow.
Once your cards get classified using CoS, they are ready to be pulled in the Kanban system.
And while visualizing the work on a board is a great way to improve transparency, relying on the board alone isn’t enough to achieve stable and predictable workflow.
Costly delays, team overburden, and productivity losses can still happen and you need to take preventive actions. This is where another core practice of the Kanban Method comes to the rescue — limiting work in progress (WIP).
Stay Focused On One Thing At A Time: Limit Work In Progress In Each Trello List
Work in Progress (WIP) limits in Kanban help you align customer demand with your team’s capacity. They prevent work from piling up and ensure your team concentrates on finishing old work, rather than starting new work.
Software development, perhaps more than any other industry, is plagued with constant multitasking and context-switching. WIP limits are the antidote which lets you focus on one thing at a time.
To set up WIP limits on your Trello lists, install the List Limits Power-Up on your board. Add the maximum amount of cards per each state. Remember that To Do and Done lists shouldn’t have any limits as the work there isn’t in progress.
Say you’ve added a WIP limit of 5 tasks to your Testing state. This means that if there are already five cards in Testing, no new work can enter this workflow step until any of the five tasks gets finished and moved onto the next step.
The number of tasks along with the WIP limit will appear atop of each list. If the WIP limit is exceeded, the list will light yellow, indicating a bottleneck is brewing in your workflow.

Proper WIP limits will ensure your team is never overburdened yet always has something to do.
Finish What You’ve Started: Implement A Pull System
Very often, excessive WIP in your workflow springs up when work is pushed down the line by management. This approach interferes with your team’s efficiency, as more and more work has been started but nothing actually gets finished due to constant multitasking and context-switching.
Implementing a Kanban pull system is a good way to address this issue.
A pull system means tasks are pulled from the To Do list in your Trello board by team members if and only if they’re at capacity to handle new work.
Switching to a pull system prevents work from piling up and aligns your task arrival rates with delivery rates, rendering your workflow stable and predictable.
In a pull system, management defines the priority of a task by assigning CoS before placing it in the To Do column. Once the delivery team has an empty slot, they pull the task from To Do list to the Development list in Trello. This is the point of commitment. The task is now in progress and the team has a responsibility to deliver it.
This approach allows management to reprioritize tasks up until the moment it is pulled into the process. It’s a flexible way to remain adaptive to the market changes, as you’re always working on what’s most important first.
Also, in Trello, team members self-assign themselves on each card they pull, following the set priorities and explicit policies. This creates a culture of trust and autonomy, enabling teams to grow more self-managed, which boosts the overall productivity and efficiency of your system.
Kanban Analytics Through Nave: When ‘Good Enough’ Isn’t Good Enough
Applying core Kanban practices on Trello can help you increase the visibility of your workflow, make your team more productive and your system more predictable.
But when good enough isn’t good enough and you’re looking for a way to optimize your processes through data-driven decision making, it’s time to look at Kanban analytics — tools that turn your Trello board data into immersive graphs.
The Kanban Analytics Power-Up enables you to analyze your data and see the full picture of your progress. You can leverage this information to take preventive and corrective action that will take your team to the next level.
Improve Workflow Efficiency Using The Cumulative Flow Diagram
”An ounce of prevention is worth a pound of cure”, they say, and this strongly applies to Kanban. Spotting bottlenecks quickly is vital to maintaining high levels of efficiency and productivity.
The Cumulative Flow Diagram (CFD) shows you how your work in progress has changed over time, revealing bottlenecks and performance trends through its ebbs and flows.
With the CFD, you can gain an instant understanding of the state of your workflow. The colored bands are your Trello lists so you can track how many cards you have in each one as well as the total amount of work in your process.
Pay attention to bulging bands on your CFD. This means WIP is increasing, your delivery times are increasing and you’re at risk of context switching, multitasking, and delays.
Flat bands are another pattern to look out for. The longer the lines, the longer your cards stay in one place. Something is blocking your process and nothing is getting done.
You can also see how fast, on average, cards move across your Trello board to completion (cycle times), as well as your average throughput over a given time range. The CFD calculates your main flow metrics and helps you evaluate the stability of your system.

An ideal CFD represents a steady growth of completed work and a continuous delivery of value. But the reality is seldom ideal.
There will be deviations in your workflow. The great thing about the CFD is that it captures everything you do on your Trello board and raises a red flag when there’s a growing bottleneck in your system. You just need to learn how to recognize the most common CFD patterns.
Accelerate Your Delivery Times Using the Cycle Time Scatterplot
Cycle time tells you how long it took you to complete a task, from start to finish. This key flow metric should be measured and improved if you want to speed up your delivery times and release customer value sooner.
The Cycle Time Scatterplot (CTS) can be of great help here, as it displays cycle times for all of your completed tasks within a specific time.
Each dot on the scatterplot is a single Trello card. By hovering over it, you can view its end date and cycle time. Watch out for common CTS patterns that the dots form together!
How many times have you asked yourself: ”How long will this take?”
The dashed horizontal lines tell you how likely you are to complete a task in a given time. Use them to accurately forecast completion times on your next assignment.
Set Commitments With Confidence Using The Cycle Time Histogram
By knowing how fast you’re able to deliver work, you can forecast the cycle time of future work items and use that information to commit to deadlines with a higher level of confidence.
The Cycle Time Histogram (CTH) compares your past cycle time data in a clear, presentable manner.
You can track your mean, median and mode average cycle times to observe how trends build over time. With the Cycle Time Histogram, you can also assess the stability of your system. If the width of the spread is too long, the variability of your process is too high, resulting in lower predictability.

Use the Cycle Time Histogram to define service level agreements with your clients and stakeholders. The dashed vertical lines on the graph will point out the probability of tasks being completed within a certain timeframe.
When making delivery commitments, it’s recommended that you start off with the 85th percentile line.
Prevent Delays And Blockers With The Aging Chart
Tasks can get stuck in your workflow for many reasons. Internal and external blockers, neglected and forgotten tasks, unclear requirements, and miscommunication — these are only a handful of causes behind delayed work in progress.
Identifying slow process states is the most effective way of preventing delays and increasing your process efficiency.
To spot outliers blocking your system, you need to track how much time tasks spend in progress. The Aging Chart offers a detailed overview of the time every task spends in each process state.
Layout-wise, the Aging Chart resembles your Trello board, with each column representing a state in your process. Each dot stands of a card on the board. The higher the dot on the chart, the longer the task is taking to complete and the higher the chances of a delay.
The chart also builds upon your past data, which lets you monitor how tasks aged back in time. The horizontal percentile lines show you the percentage of tasks that were previously completed in that time. This means that, once a dot has climbed past the 50th percentile, it’s already taking more time to complete than half of your previous tasks.
You can use the Aging Chart to actively monitor and manage your work in progress so that no work slips through the cracks unnoticed.
Stabilize Your Delivery With the Throughput Run Chart
A steady pace of delivery makes for a stable workflow. To analyze how many tasks you’ve completed in a certain timeframe, you need to track another crucial flow metric in Kanban — throughput or the amount of tasks delivered in a certain time period.
You can use the Throughput Run Chart to keep track of your daily, weekly, and monthly throughput.

The chart collects your past data to draw a throughput trendline. When the line goes down, it means you deliver less work than before and a blockage prevents your team from delivering consistently.
Monitor Your Performance Using the Throughput Histogram
Observing your throughput trends over time helps you gauge the performance of your team. If the throughput increases, your team delivers more in the same amount, or less, time.
However, when the throughput values go down, it means that bottlenecks, unclear requirements, technical debt or other problems block your team from performing at their full capacity.
The Throughput Histogram shows you the number of tasks completed in a day for a selected timeframe. The chart’s overlay displays your mean, median, and mode average throughput.
Assess Your Process Efficiency With The Flow Efficiency Chart
Flow efficiency is another key metric in Kanban, telling us how much time we spent actually working on tasks.
You can easily calculate your flow efficiency percentage by dividing the time you actively spend working on a task with the time it took you to complete it and multiplying the result by a hundred.
For example, if your team needed 10 days to deliver a task and has spent 4 days working on it, their flow efficiency is 40%
4/10 x 100 = 40%
Trimming down on your waiting times and boosting flow efficiency starts with pinpointing where your tasks spend time waiting. You can reveal these with an Aging Chart before diving deeper into the reasons behind delayed work.
You can also use the Flow Efficiency Chart to evaluate how your efficiency trends changed over time, while also displaying your average flow efficiency percentage.
Transforming The Way Your Team Works Together
What sets Kanban apart from other methods? Its ability to stir positive organizational change in a frictionless way that minimizes resistance. You can apply it on top of your existing practices without having to make any sweeping changes to your current workflows.
To get going, start visualizing your process, apply WIP limits, and switch to a pull system. Then, you can leverage the power of your Trello board data using Kanban analytics to optimize your workflow efficiency.
Experiment with the Kanban Method on your Trello board and see how your visibility, efficiency, and productivity improve. Trello offers a great way of organizing your work, and Kanban optimizes the way you get the same work done.
This is a guest post by Nave. Learn even more about their product and how it integrates with Trello here.
Good or bad, we’d love to hear your thoughts. Find us on Twitter (@trello)
Next: Full Speed Ahead: How To Accelerate Agile Teams With Trello