
We’re excited to announce that you can now do much more to visualize and communicate your team’s state of work with Trello’s new Dashboard view, a project reporting tool for Trello Business Class and Enterprise customers.
As Trello shifts to become a tool which better reflects the digital workspace with, better digital communication, Dashboard view brings insights into how teams are functioning from anywhere in the world.
Try out the new views on your Trello board with a free trial.
Staying on top of project progress and status updates are key when you are leading a team. The need for more project visibility and a deeper understanding of the work that is being done and carried out as a team helps cut through the noise, eliminate roadblocks, and focus on what is important to success.
After all, isn’t that what great leadership is all about? To find a balance between the day-to-day tasks of running an operation while making sure that everything is going according to plan. Accessing and managing the right information at the right time enables your team to effectively negotiate in the decision-making process with stakeholders and solve problems for the best interest of everyone involved.
Don’t Let Your Insights Get Out Of Sight
As a busy leading bee, you’d rather spend more time digesting meaningful insights than digging up the data and turning it into something comprehensive. However, the risks of not dedicating resources to reporting and updates can be devastating for your project.
Let’s look at some ways that leaders can’t support their teams effectively when information is siloed or inaccessible.
- Becoming too task-focused. When there is a disconnect between the strategy and the execution of a project, you can lead your team into a turbulent territory where no one has a clear understanding of what has to be prioritized and completed by whom.
- Being too reactive. If you find yourself spending all of your time trying to put out fires, then you aren’t using your time to your advantage. Being able to predict a situation and adopting a proactive attitude can take your team the extra mile.
- Not communicating well: As an effective team leader, you need to communicate your needs clearly by presenting both your expectations to team members in a way everyone can understand.
Luckily, there’s an end to these woes in sight! We built a new feature in Trello to help you tackle these common reporting and management issues once and for all.
Perfect Any Project With A Dashboard View
The Dashboard view is geared toward helping your team understand how your project is progressing, gain actionable insights to help move work forward, and align stakeholders on project status.
Bringing a bird’s-eye view to projects and processes allows you to manage workloads and prevent bottlenecks before they begin. Tasks can be redistributed as needed to prevent team burnout or make sure there is appropriate coverage when a teammate goes on leave. Seeing the big picture of what everyone’s working can save a project from going off the rails. By visualizing key metrics such as due dates, assigned cards, and cards per list, you can keep stakeholders aligned and confidence running high at any stage of your project.
Let’s take a look at how you can use valuable insights for your project.
How It Works
With Trello Dashboard, you will have a way at your disposal to communicate your multiple data points from your Trello board in an easy to digest manner.
Get ready to manage project roadblocks and monitor project progress by accessing the dashboard from the view switcher at the top left-hand corner of your board
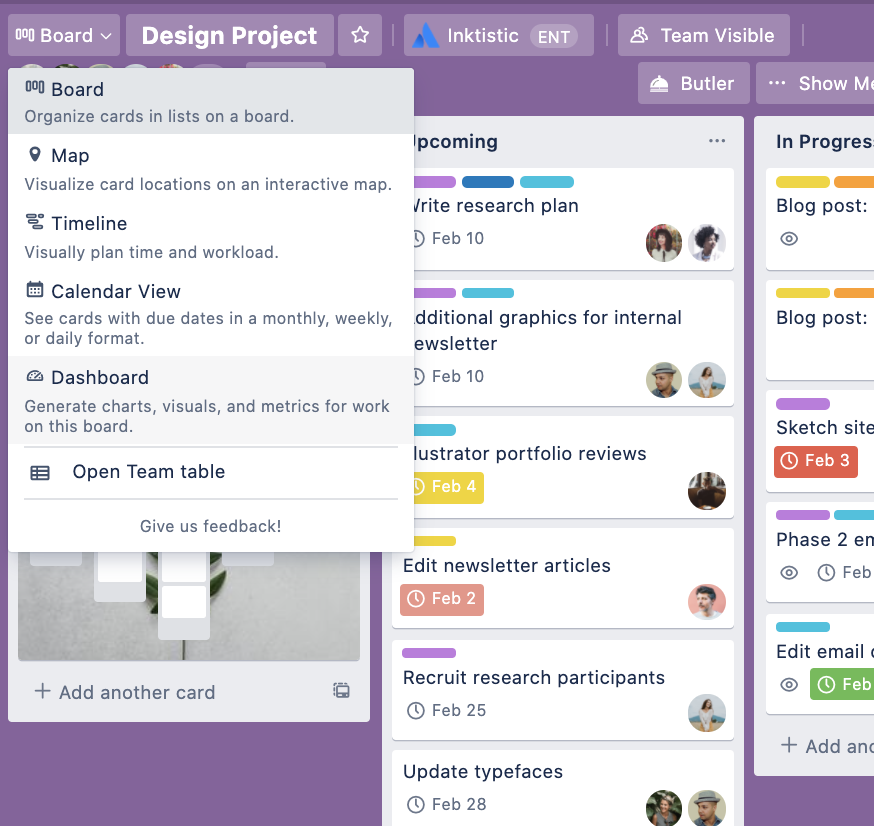
Using Dashboard View
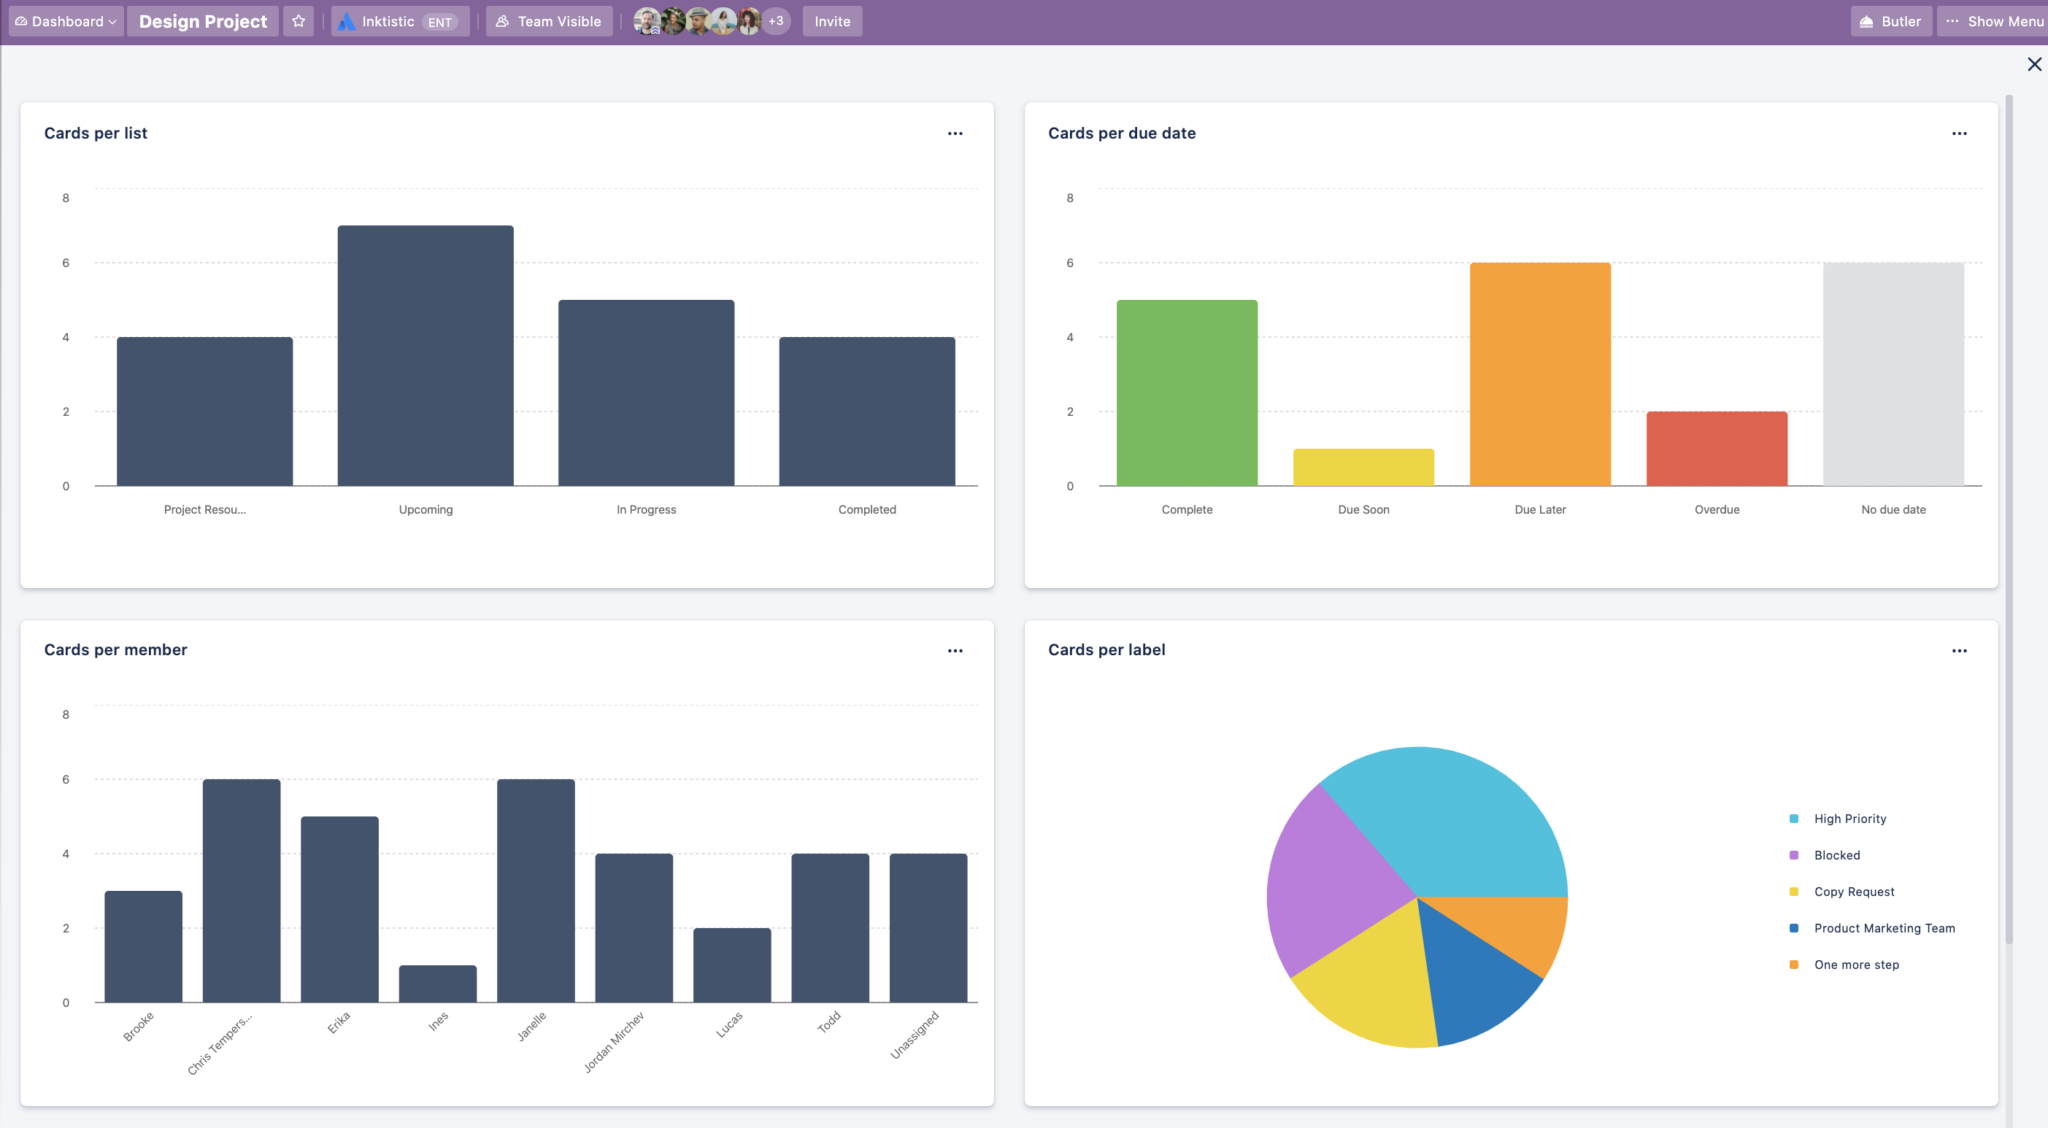
Voila! Start organizing work and visualizing the data in an instant. To help you evaluate your workload, by default, Trello starts you off with four charts based on card counts per filter:
- Cards per list
- Cards per member
- Cards per label
- Cards per due date status
Customization
If that’s not what you’re looking for, you can tailor the information that appears on the Dashboard by adding or removing charts.
Just click the “+” at the bottom of the Dashboard view to add new tiles.
Now that you have everything we need to evaluate our project you can take the customization a step further by editing the tiles. At the top right hand corner of each tile click the 3 dots “…” to edit or delete the tiles.
Editing allows you to choose between visualizing your data in a bar graph or pie chart and then you can specify the type of board data (Cards per list, Cards per due date, etc.. ) you would like to visualize in the filter.
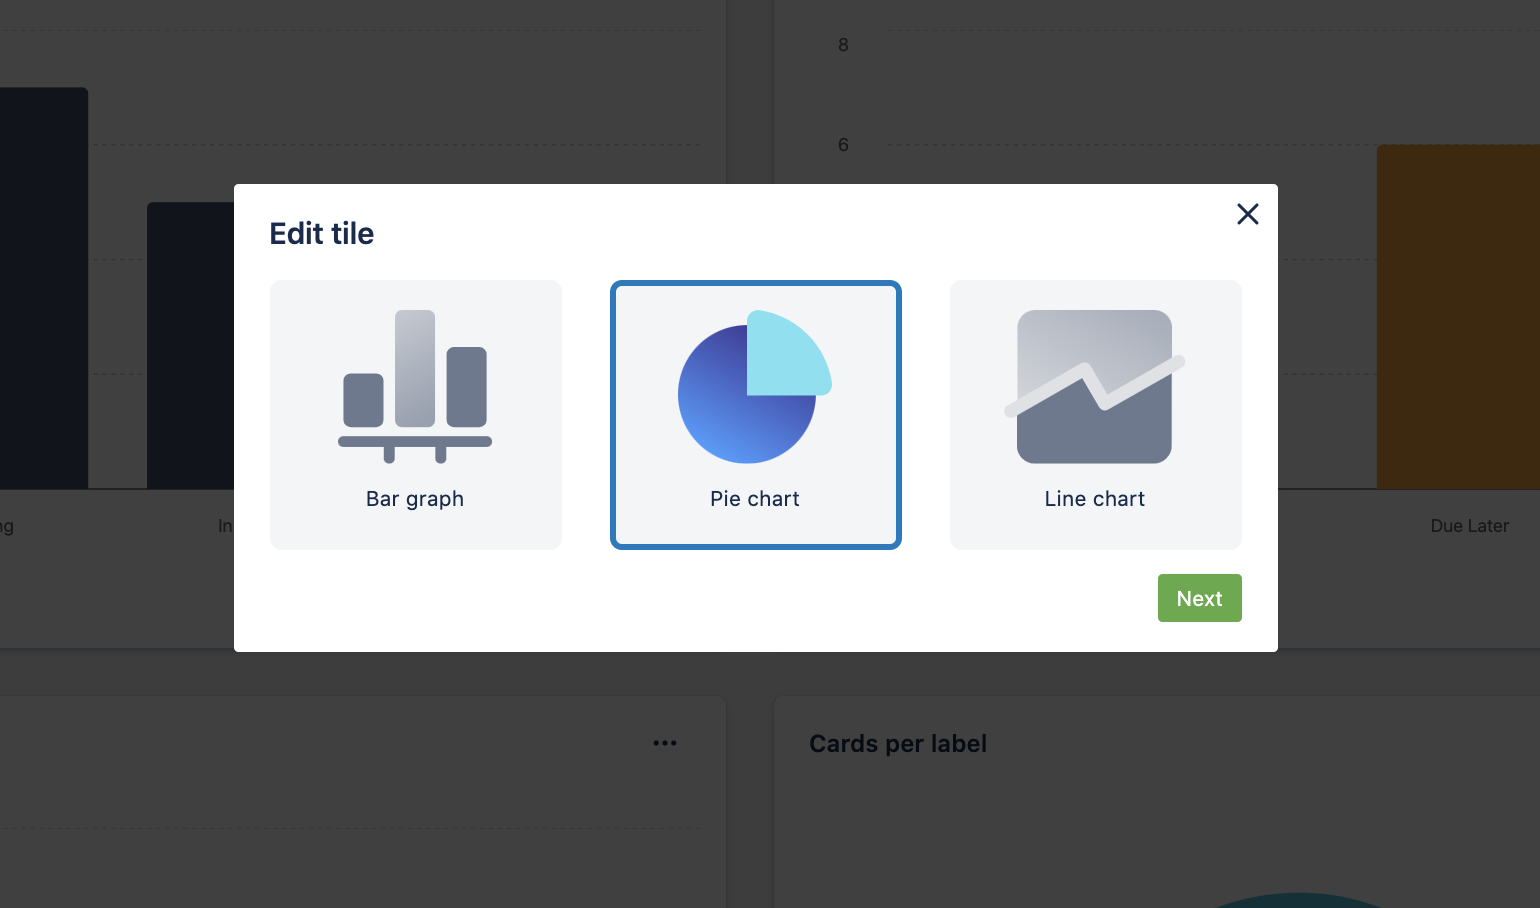
By choosing the edit option, you can quickly jump to other data points on your board.
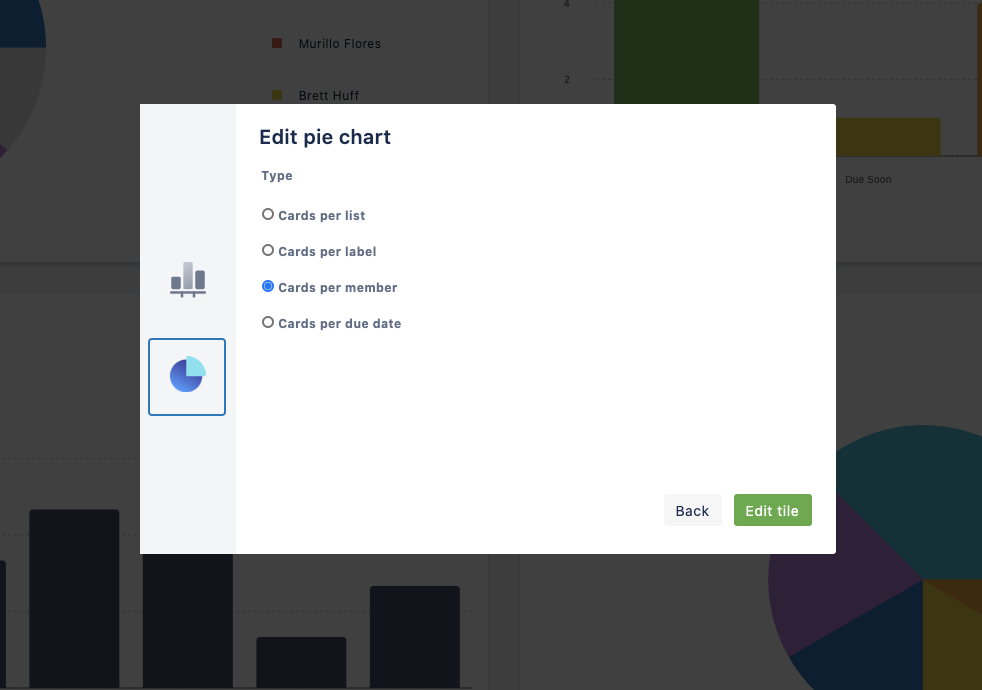
Edit your tile to view a different data set within the filter.
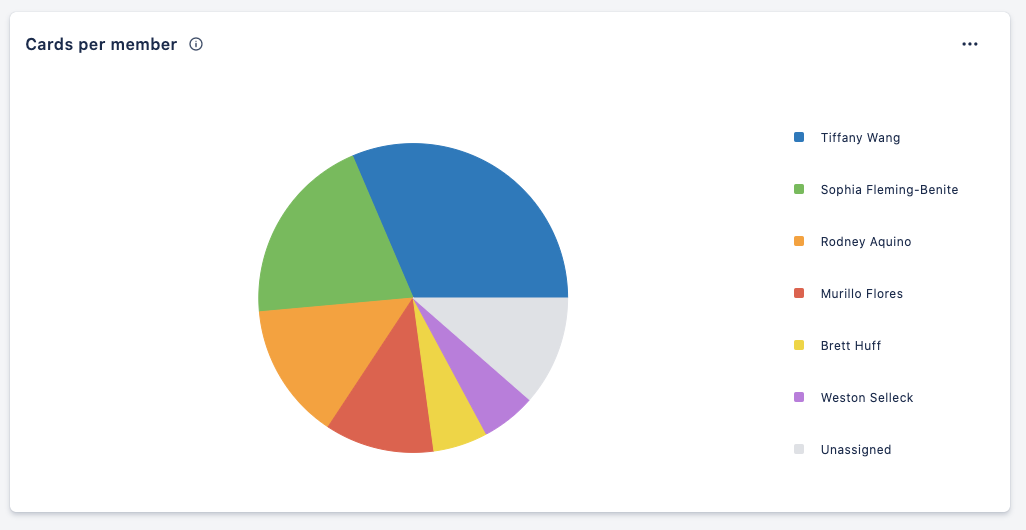
Card Counts Per Various Filters
For a numeric reference of your visualized data, just hover your mouse over the pie charts or bar graphs to see the number of cards included in the filter’s count.
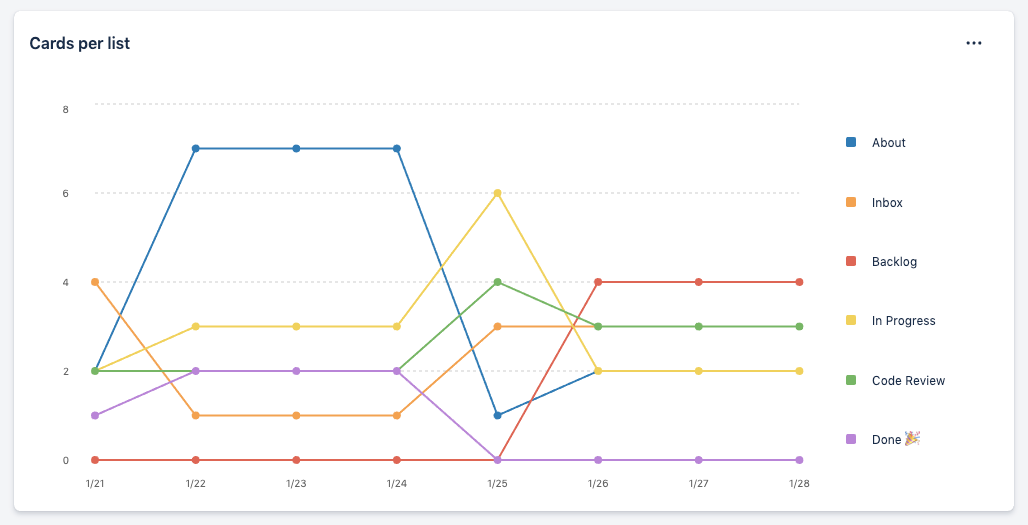
Take A Look Back With Historical Reporting
You will also have historical reporting available in the new Dashboard view with the ability to view cards per list, per label, per member, and per due date status over the past month so you can see how work has progressed over time.
Dive Into The Details With Dashboard
You can start enjoying the new Dashboard experience today if you are a member of a Business Class or Enterprise team board (including guests).
In the coming months, we will be rolling out more useful functionality to help you take reporting in Trello to new levels.
- Drill downs: Click into charts to see and update the cards they reference
- Big number tiles: See a spotlight of one card count, magnified in a tile of its own
- Data, data, data: More types of data points in the Dashboard view charts, like Custom Field calculations or Advanced Checklist information
- Export Dashboard for easy presentation
As we are building these new features, we’d love to hear from you. If you have feedback to share with our team, please follow the feedback link in the yellow banner at the top of the Dashboard view on your board.
Try out the new Dashboard view and start building your reports now with a free trial.
Want To Learn More? Watch Our On-Demand Webinar!
On March 2nd, 2021 we held a webinar to answer all of your questions aboutTrello’s new views and card types, show off some demos, and talk about the exciting future of Trello.
Plus, we were joined by special guest, Trello co-founder Michael Pryor, for the Q&A segment.
Watch the recording of this webinar on-demand today. This on-demand webinar is free for all to view.